Action Maps for Red Team Presentations
Action Maps are essential visual tools for red team assessments that transform complex attack chains into clear, understandable narratives by mapping out the progression of techniques, access points, and critical findings discovered during a red team engagement.
2/25/20253 min read


Action maps are vital tools that visually represent the progression of a red team assessment. They help stakeholders understand the attack paths, techniques, and potential impact of security findings. While Action Maps are generally delivered at the completion of an assessment, I've been on engagements where we provided them to the client every two days. These maps are crucial for presenting the attack narrative and visually depicting the assessment through chained attacks. Since visual depictions are easier for all audiences to understand, they're critical for both presentations and assessment reports.
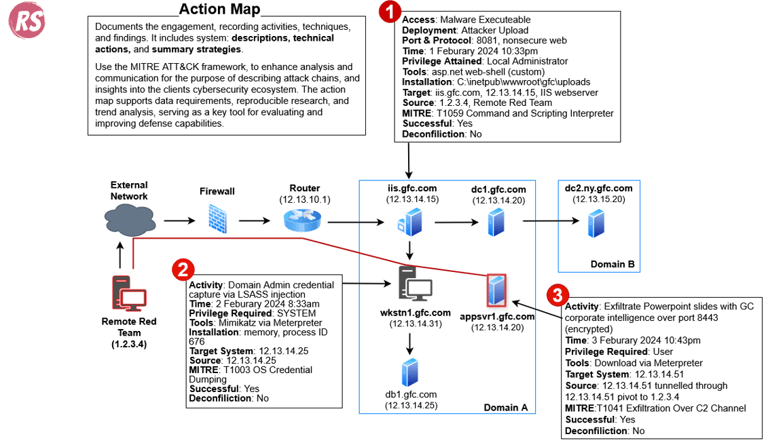
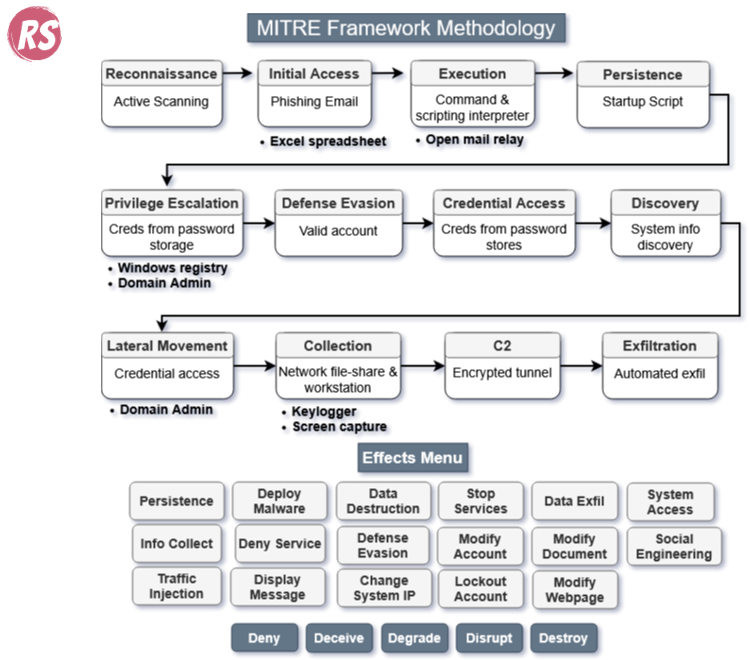
It's important to develop the Action Map narrative throughout the assessment to ensure accuracy and timeliness. I've used two distinct methods—the wire diagram and the MITRE ATT&CK phases. Both are well-received, though I prefer the wire diagram for its specific system details. Choose whichever approach works best for you—just ensure it's visually clear and follows a systematic approach detailing the attack chains.
Purpose and Overview
An action map serves as a strategic and operational tool in red team reporting, providing multiple essential functions that help stakeholders visualize, understand, and act upon assessment findings. These comprehensive visual representations not only document the technical progression of attacks but also serve as invaluable communication bridges between technical and business audiences in red team reporting:
Provides a clear visualization of the attack chain and progression.
Demonstrates relationships between different techniques and phases.
Helps prioritize remediation efforts by showing critical attack paths.
Supports both technical and non-technical understanding of the assessment.
Core Components
1. Initial Access Points
Catalog all access vectors and entry points identified and leveraged during the assessment, including both successful and attempted pathways that were discovered through careful enumeration and reconnaissance activities:
External-facing services and applications.
Social engineering endpoints.
Physical access points.
Wireless network access.
2. Lateral Movement Paths
Analyze how the assessment progressed through the target environment, mapping out the sequence of movements and access elevations that occurred during testing. This includes identifying and documenting all paths taken between systems, networks, and security boundaries, providing a holistic view of how your team traversed the infrastructure:
Host-to-host connections.
Network segment traversal.
Domain relationships.
Trust relationships exploited.
3. Privilege Escalation Points
Document the specific locations and methodologies employed to achieve elevated privileges within the target environment, including identification of vulnerable services, misconfigurations, and authentication mechanisms that enabled privilege escalation across various system layers and security boundaries:
Local privilege escalation.
Domain privilege escalation.
Service account compromises.
Administrative access achieved.
Creating the Action Map
1. Planning Phase
Gather all assessment notes and documentation.
Review assessment logs and timestamps.
Identify key systems and pivot points.
Determine the most significant findings to highlight.
2. Design Elements
Use consistent shapes for different types of actions.
Implement clear directional indicators.
Include timestamps for critical events.
Color-code different phases or severity levels.
3. Technical Details
Document specific tools used at each stage.
Include relevant command syntax.
Note successful exploitation techniques.
Reference associated evidence files.
Best Practices for Presentation
1. Visual Layout
Maintain clear hierarchy of information.
Use appropriate spacing and grouping.
Ensure readability at presentation scale.
Include a legend for symbols and colors.
2. Supporting Information
Provide brief explanations of technical terms.
Include relevant system details.
Reference related findings and recommendations.
Link to detailed technical documentation.
Common Tools for Creating Action Maps
Draw.io - Free, web-based diagramming tool.
Microsoft Visio - Professional diagramming software.
MITRE ATT&CK Flow Generator - Model and visualize attack sequences.
Review
Action maps are powerful tools for telling the story of a red team assessment. A well-crafted action map bridges the gap between technical findings and business impact, helping stakeholders grasp and act on security recommendations with confidence. The ultimate goal is to create a clear, actionable visualization that drives informed decision-making and security improvements. Stay focused on clarity, relevance, and tailoring the level of detail to your specific audience.
Example Action Map Structure
Check out my Github repo for easy-to-use templates made for draw.io.